Your Overall Website Score
The following report was created for unifysquare.com by Walker Sands and includes key statistics on your site's design, load speed, Google rankings and SEO efforts.
Scroll to see how you did.
Key Web Indicators
Strong search presence demands a site equipped with a solid technical infrastructure.
PerformanceiGoogle Lighthouse's 'Performance' score tests speed metrics such as first contentful paint, speed index, time to interactive, first meaningful paint, first CPU idle and estimated input latency.
AccessibilityiGoogle Lighthouse's 'Accessibility' score audits whether website content is properly accessible, tagged and organized for users with disabilities.
Best PracticesiGoogle Lighthouse's 'Best Practices' score audits whether a website is using proper security protocols, strong responsive/mobile designs and proper handling of browser errors.
SEOiGoogle Lighthouse's 'SEO' score tests whether a website is properly optimized for search engines in terms of crawling and indexing and html formatting.
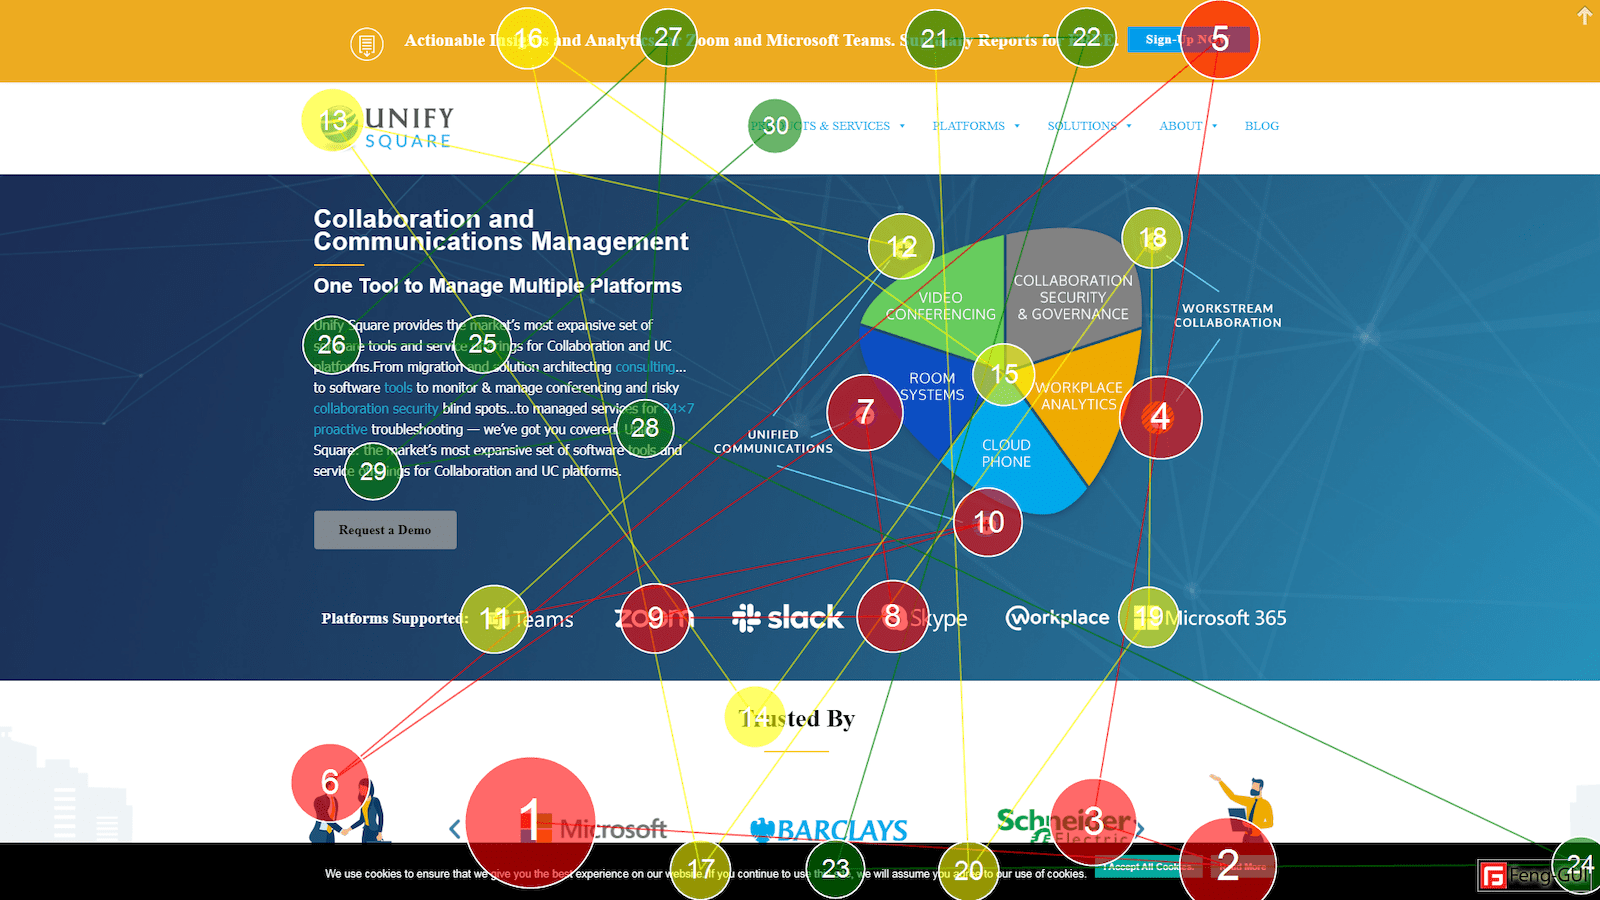
What Message Are You Giving Your Visitors?
The numbered path shows the order a site visitor views items on your website within the first five seconds. You want your customers to focus on your key message and calls to action that will drive them deeper into your website.
Is Your Site Being Discounted By Google?
Google research shows that 53% of users abandon a website if the Speed Index exceeds three seconds. Google may also discount your site for extremely slow load time.
First Contentful PaintiGoogle Lighthouse's 'First Contentful Paint' marks the time at which the first text or image is painted.
Speed IndexiGoogle Lighthouse's 'Speed Index' shows how quickly the contents of a page are visibly populated.
Largest Contentful PaintiGoogle Lighthouse's 'Largest Contentful Paint' marks the time at which the largest text or image is painted.
Time to InteractiveiGoogle Lighthouse's 'Time to Interactive' is the amount of time it takes for the page to become fully interactive.
Total Blocking TimeiGoogle Lighthouse's 'Total Blocking Time' is the sum of all time periods between FCP and Time to Interactive, when task length exceeded 50ms.
Cumulative Layout ShiftiGoogle Lighthouse's 'Cumulative Layout Shift' measures the movement of visible elements within the viewport.
Does Your Website Generate Conversions?
This heat map shows the areas of your homepage where visitors' eyes are immediately drawn when first viewing your site. The darkest red areas are the most viewed areas on your site. Leverage design, color and contrast to effectively guide visitors through your website, eventually driving them to convert.

You Might Also Like —
Case Study
Website Redesign & Development
A redesigned, mobile-first website leads to 78% conversion rate increase for leading workflow automation provider.
Case Study
Website Redesign & Development
Mattersight's new website drove 385% new visitor increase and is helping more premiere brands transform their customer conversations.